
Evaluating Profiles with ColorThink Pro
By Chandramohan Seetharamiah Srinivasaraju
Color Management
Objective
It is critical to check the quality of ICC profiles prior to use. Sharma (2004) states: “If the quality of a profile is poor, the results are likely to be poor” (p. 325). Clearly, the ultimate test of a profile is to use it in a workflow, but such tests are expensive and tend to lead the user on a path of iterative trial-and-error, which largely defeats one of the key benefits of ICC-profile based color management. Here, a procedure for printer profile evaluation using Chromix® ColorThink Pro software is outlined, with the goal of providing readers with a step-by-step methodology for such evaluation. For more detailed information on ColorThink Pro, readers are encouraged to reference ColorWiki (Category:Manuals, n.d.) and Ashe (2014) Color Management & Quality Output, Focal Press.
Assessment of ICC profiles and color reproduction involves expertise from color science, psychophysics and image analysis. The first approach used in the present analysis evaluates the accuracy of a press profile “round-trip” test that is conducted using only the software, without costly hard copy output. Profile accuracy is defined as the color difference between what you desired (e.g.: your original image) and what you obtained, (e.g.: the reproduction). This difference is expressed in Delta-E (Sharma, 2004). Round-tripping involves conversion from device to CIELAB values (otherwise known as the inverse side, or B2A transform) and then subsequently from CIELAB back to CMYK (also known as the forward side, or A2B transform). The Delta-E difference between B2A and A2B is evaluated to see the accuracy of the reversibility (Sharma, 2005).
Chromix® ColorThink Pro is an extensive software suite of tools specifically designed for the evaluation of ICC profiles. ColorThink is an application created by Chromix®, and has many features and tools that allow the analysis of profiles, workflows and measured quality. As a workflow tool, ColorThink enables users to analyze the overall process involved in producing images and profiles from start to finish, and displays what happens to the color throughout the transforms (Ashe, 2014).
Materials and Apparatus
In this evaluation, the material and equipment utilized are as follows.
1. CMYK value of IT8/7.4 chart saved in a text file.
2. HubUncoated1_M2.icc, a custom ICC profile of a CMYK Offset Lithographic press condition on uncoated stock. This is the profile that is analyzed here, users would select their own profile for an analysis.
3. Industry standard “US Sheetfed Uncoated SWOP v2” profile.
4. A computer running ColorThink Pro software.
5. RGBXPLORER8.tif file from hutchcolor website.
6. TestForm_RGB_Flatened.tif, a custom test form consisting of images displaying highly saturated colors and detail. Users are encouraged to create their own test form for profile analysis.
Experiment
This experiment involves several steps to evaluate the profile, as outlined below.
Step 1. The following steps are used to round trip the HubUncoated1_M2.icc profile and evaluate the colorimetric values which comprise the 1,617 patch IT8/7.4 target. The goal is to evaluate resultant CIELAB values to ascertain how close the colors values are after passing though both the inverse side (B2A) and the forward side (A2B) of the profile.
1. Open ColorThink Pro, then open a new Color Worksheet.
2. Drag and drop the IT8/7.4 test chart file “HubUncoated1_M2.txt” into the Colors section. The CMYK values of each of the 1,617 patches in IT8/7.4 test chart will appear first in the Colors section, an image of the IT8/7.4 test chart appears in the Images section and “” appears in the Profiles section.
3. Drag “HubUncoated1_M2.icc” profile on to the “” in the Profile section to assign the profile to IT8/7.4 test chart.
4. Each of the CMYK patch in the Colors section is assigned CIELAB value from the chosen profile. The CMYK patches of the IT8/7.4 test chart are converted CIELAB using forward (A2B) transform.
5. Drag the “HubUncoated1_M2.icc” profile in the Profile section and drop on the IT8/7.4 test chart into the Images section.
6. Duplicate IT8/7.4 test chart image of HubUncoated1_M2.txt, which is displayed with the HubUncoated1_M2.icc profile assigned in the Profile section.
7. Select the rendering intent for the transform: as a default, it is “Relative Colorimetric,” for the purposes of the present analysis “Absolute Colorimetric” is selected.
8.The CIELAB values obtained from A2B transform are converted to CMYK values, these values are calculated using the inverse (B2A) transform.
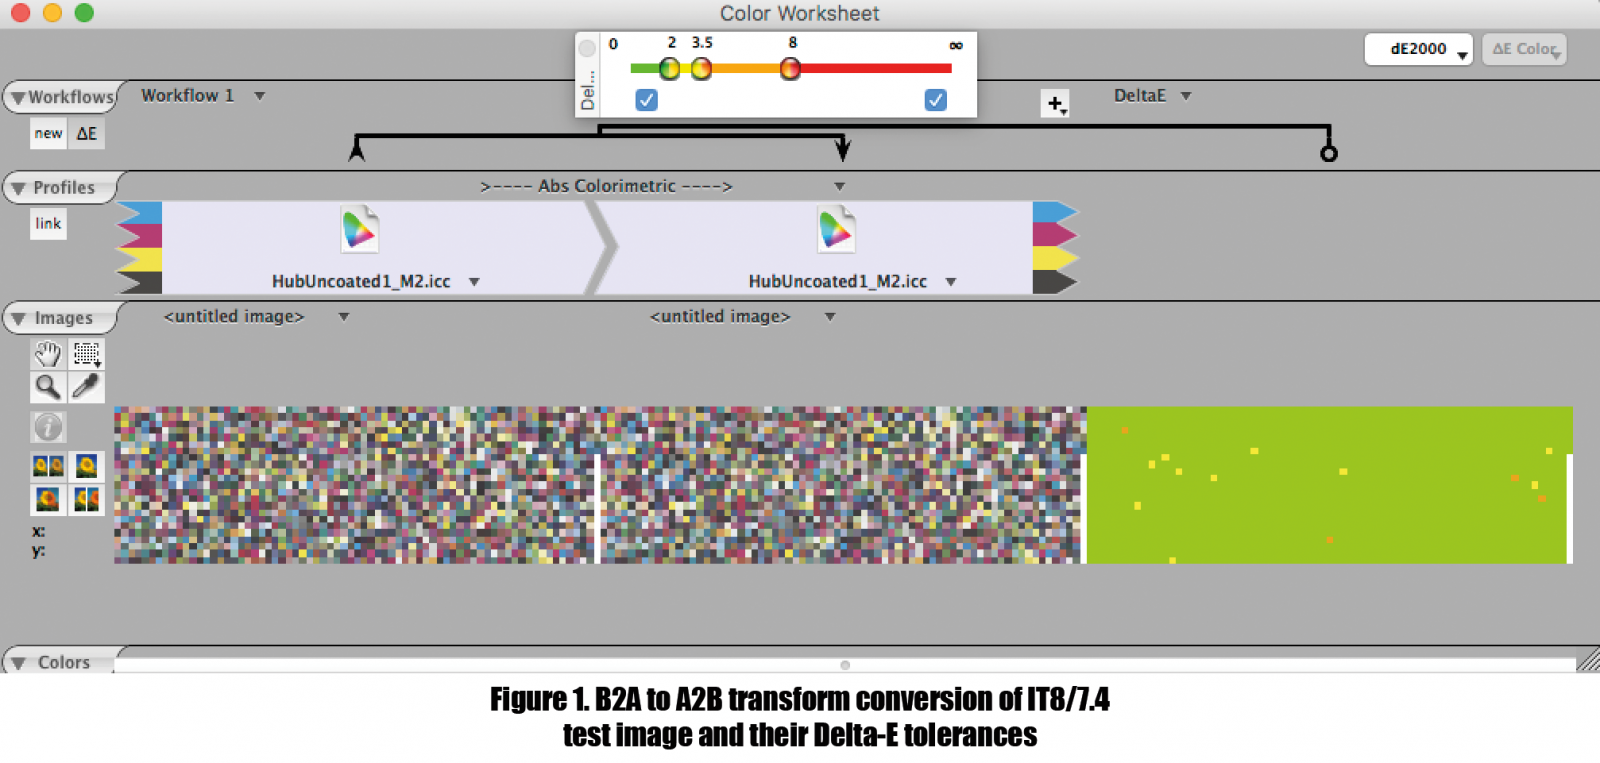
9. Click the Delta-E button to calculate the Delta-E values between the source CIELAB values used in A2B transform and reference CIELAB values in the subsequent B2A transform. Evaluate the Delta-E of the chart Image by looking at green, yellow, and red Delta-E tolerance range on a small popup window. Green represents tolerance of 2 Delta-E, yellow represents tolerance of 3.5 Delta-E and red represents the tolerance of 8 Delta-E, as illustrated in Figure 1.
Step 1 Results. The Delta-E values in the Colors section (Figure 2)
are sortable, the values should be selected so that they are displayed from the largest to the smallest. As there are 1,617 patches, the 81st value represents 95th percentile, this is a good indicator of the quality of the profile. The Delta-E of the 81st patch value in this example is 1.72. The obtained Delta-E value of the 95th percentile is less than 2, which indicates the quality of profile “HubUncoated1_M2.icc” in terms of the reversibility of the output profile look up table (Myers, 2017).
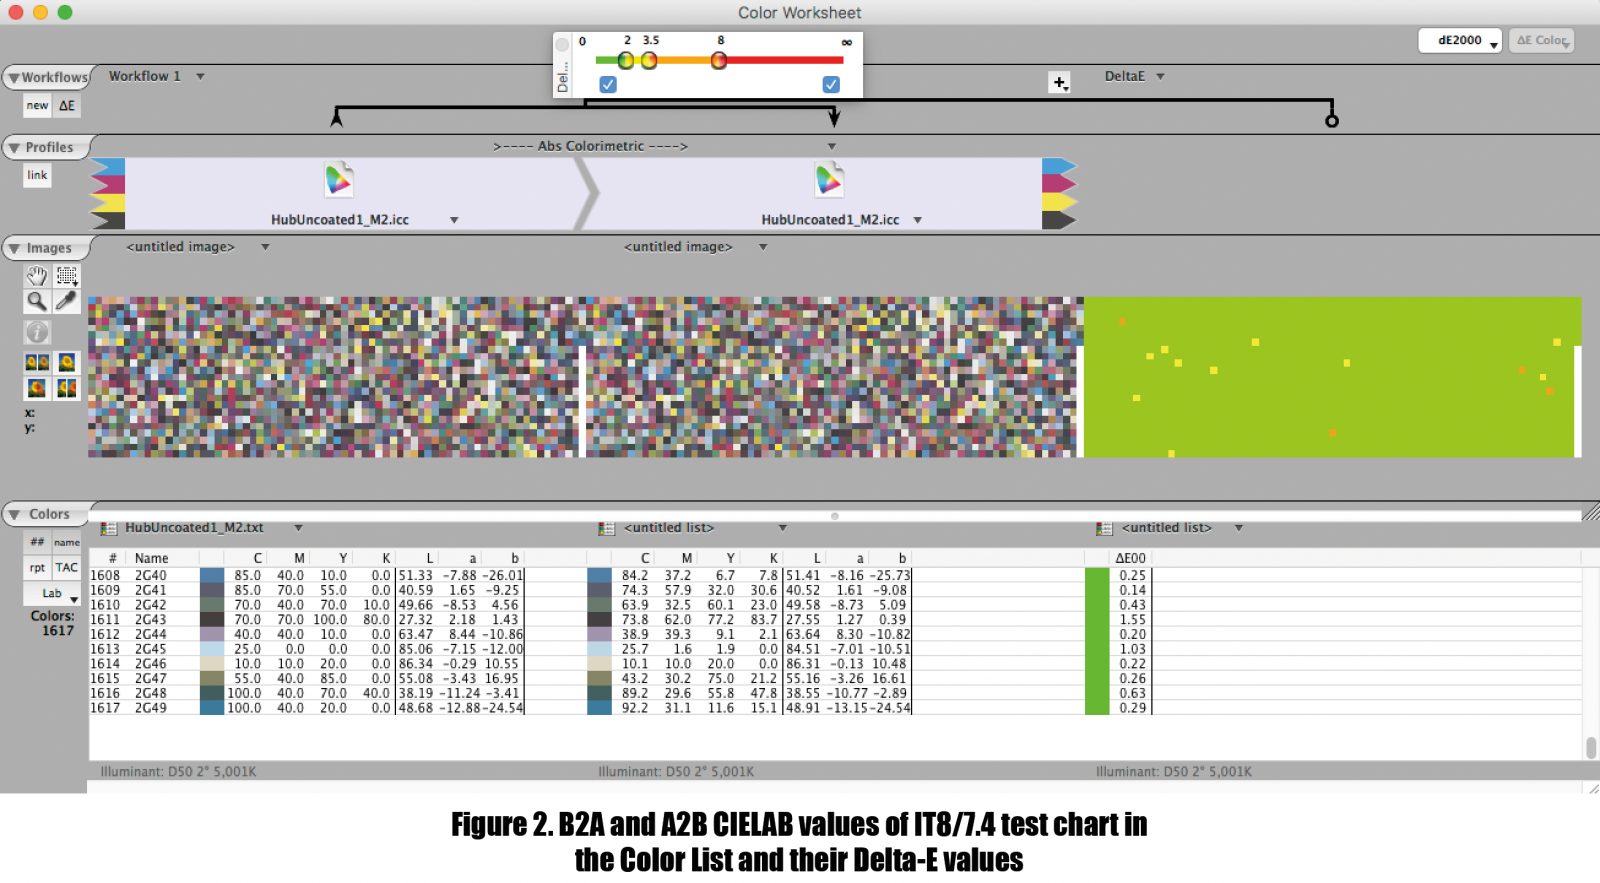
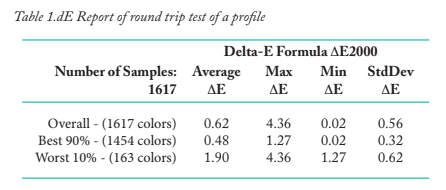
In the Colors section on the left, a selection of “rpt” generates a statistical evaluation of the Delta-E round trip results. Delta-E between the B2A and A2B transforms shows that there are fourteen color patches that are near a Delta-E of 3.0; overall statistics of the round-trip test are displayed in Table 1. It is observed from Table 1 that the average overall Delta-E values for 1,617 colors is in below 1.0 Delta-E.
Step 2. To continue the evaluation, the primary and secondary colors of the “HubUncoated1_M2.icc” are compared to an industry standard profile, here, “US Sheetfed Uncoated SWOP v2” with a goal of determining if there are any significant hue shifts that could affect the color reproduction.
1. In the ColorThink Pro, select the 3D grapher to open the Plot Items window. Drag and drop the “HubUncoated1_M2.icc” on to Plot Items window. Select Plot as: “Points”, Point Set: “primaries secondaries” and enable “joint with lines”
2. Repeat the above for the “US Sheetfed Uncoated v2” profile.
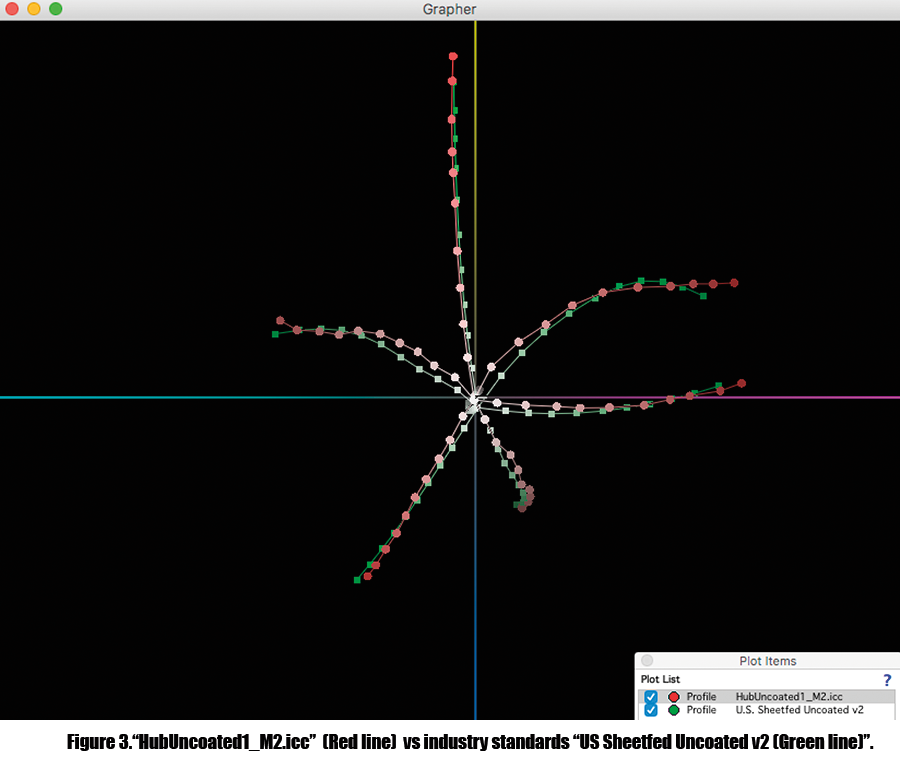
Step 2 Results. Figure 3 displays the comparison of the CMY primary colors and RGB secondary colors of “HubUncoated1_M2.icc” (Red line) and “US Sheetfed Uncoated v2” (Green line). It can be observed that the ubUncoated primaries are more saturated in the magenta and yellow regions, where the US Sheetfed Uncoated primaries are saturated in the cyan region. Secondary colors of both profiles have almost the same saturation in the green and blue regions.
However, the secondary color red with the HubUncoated profile is more saturated than US Sheetfed Uncoated. It is important to note that there is no significant hue shift observed when compared to
industry standards for the tested profile.
Step 3. In the next sept, the gamuts between the custom CMYK “Hub Uncoated” profile are compared to the standard “US Sheetfed Uncoated SWOP v2” to ascertain the state of any saturated out of gamut colors.
1. In the ColorThink Pro, select the 3D grapher to open the Plot Items window. Drag and drop the “HubUncoated1_M2.icc” onto the Plot Items window. In the Graph Control Window select 3D under Dimensions. In the Plot Items window, set the opacity to 65 percent, select Plot as: “Volume, ” Surface: “Smooth,” Res: 10% steps, select Gamut Projection and set colorimetric option to “Abs. Colorimetric”
2. Drag and drop the “US Sheetfed Uncoated SWOP v2” profile on to Plot Items window. In the Graph Control Window select 3D under Dimensions. In the Plot Items window, set the opacity to 65 percent, select Plot as: “Volume, ” Surface: “Wireframe,” Res: 10% steps, select Gamut Projection and set colorimetric option to “Abs. Colorimetric”
3. Using the mouse pointer, users can rotate the 3D plot to view them from different angles.
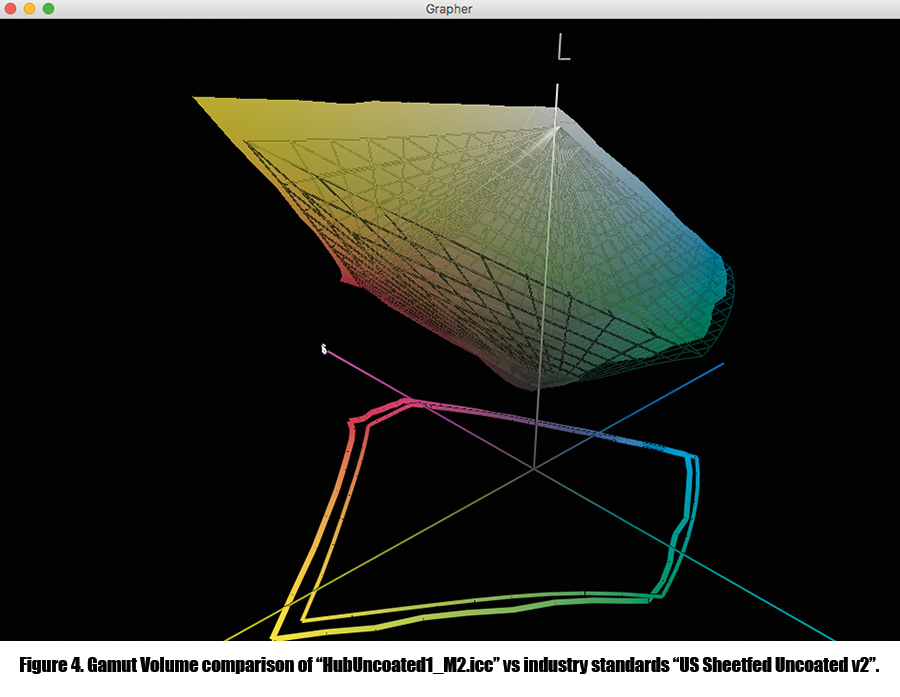
Step 3 Results. Comparing the gamut volume of both the profiles, it is
observed that the HubUncoated is noticeably unsaturated in the blue and green region, and more saturated in magenta and yellow region compared to US Sheetfed Uncoated. This is illustrated graphically in Figure 4.
Step 4. In this step, the RGB Explorer tiff file having 24 radial HSB (Hue, Saturation, Brightness) slices, pastels, micro white & black, and a continuous gray ramp is utilized to evaluate the hue shifts, rendering of neutrals and saturated colors. The RGB explorer file is available from Don Hutcheson (hutchcolor.com).
1. Open a new Color Work Sheet. Drag and drop RGBXPLORER8.tif on to the Image Section.
2. In the Profile section, assign a standard RGB Profile, here “sRGB IEC61966-2.1” is utilized.
3. Drag and drop HubUncoated1_M2.icc on to “Rel Colorimetric” in the profile section.
4. The duplicate RGBXPLORER8 image is displayed with HubUncoated1_M2.icc profile assigned in the Profile section.
5. Click on “Rel Colorimetric” and then select Absolute Colorimetric.
6. Select Delta-E in the profile section.
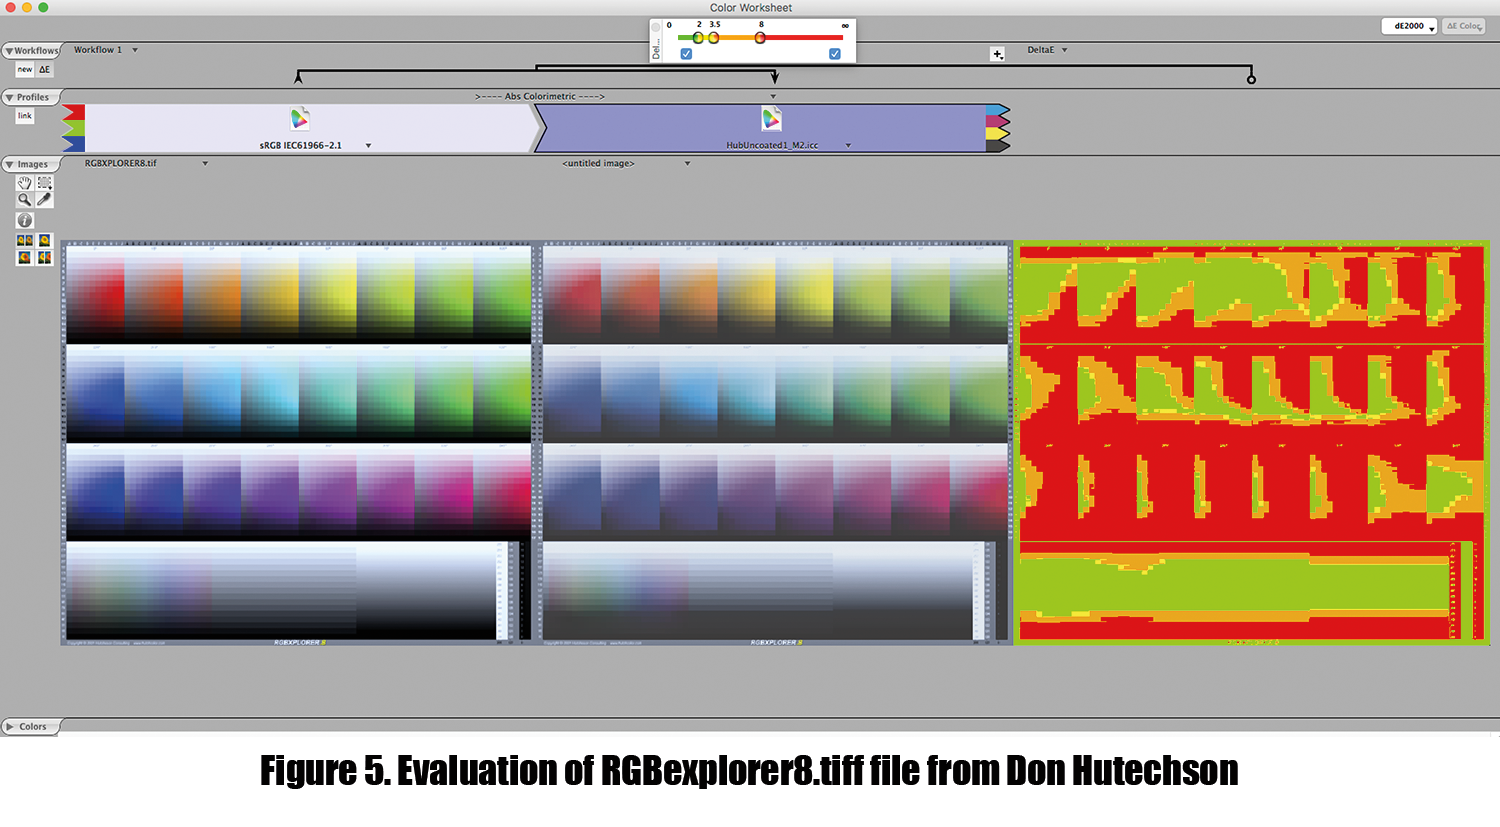
Step 4 Results. From Figure 5 it is observed that the HubUncoated1_M2.icc profile does not reproduce highly saturated colors especially well. In the
Delta-E comparison results, it can be noted that the colors of the near neutral areas are reproducible by the printing condition characterized by
HubUncoated1_M2.icc.
Step 5. This step involves a Visual evaluation of images with saturated color, to examine the presentation of detail, hue shift and gradation.
1. Open a new Color Work Sheet. Drag and drop a test form consisting of highly saturated and detailed colors with tonal transitions representative of the work being done. Here, the file used was named TestForm_RGB_Flatened.tif; this is dropped onto the Image Section.
2. In the Profile section, assign Adobe RGB (1998).
3. Drag and drop HubUncoated1_M2.icc onto “Rel Colorimetric” in the profile section.
4. The duplicate TestForm_RGB_Flatened image is displayed with HubUncoated1_M2.icc profile assigned in the Profile section.
5. Click on “Rel Colorimetric” and then select Absolute Colorimetric.
6. Select Delta-E in the profile section.
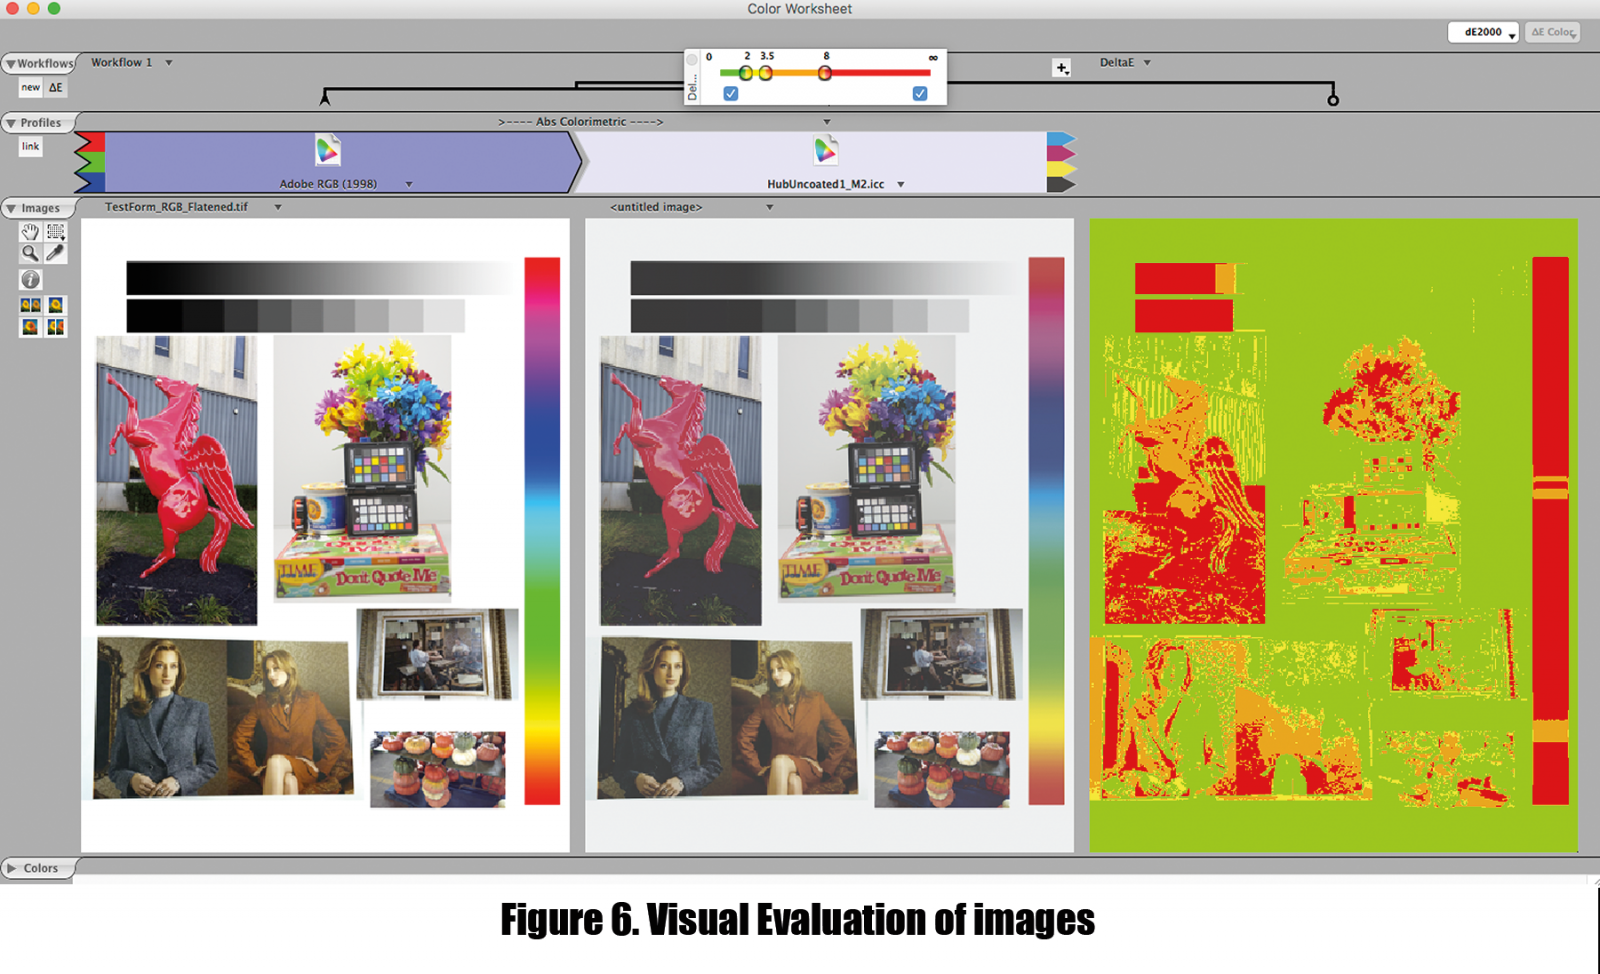
Step 5 Results. From Figure 6 it is observed that the image under Adobe RGB (1998) has a more realistic look. The flowers are vivid and skin tones look natural. The HubUncoated1_M2.icc profile does not reproduce highly saturated colors in the image because of a limited gamut. In the visual Delta-E comparison results, it can be noted that the colors of the near neutral areas, light skin tones, and natural colors are reproducible by the HubUncoated1_M2.icc and they nearly look realistic. Clearly, the CMYK profile exhibits a limited color gamut versus the RGB profile here.
Conclusions and Implications
Using the tests outlined above, practitioners can comprehensively evaluate profiles and images quantitatively using the tools in ColorThink Pro. This can possibly save costly iterations should an inadequate profile be used in production. By evaluating profiles, subsequent troubleshooting can be minimized, and users should have more confidence in their respective color management system. The benefits here may also aid in communication with customers and vendors alike, as the graphical nature of the tools is intuitive for even novice users.
References
Sharma, A. (2005). Measuring the quality of ICC profiles and color management software The Joss Group, LLC.
Ashe, T. (2014). Color management & quality output: Mastering color from camera to display to print. New York: Focal Press.
Sharma, A (2004). Understanding Color Management. Clifton Park, NY: Thomson/Delmar Learning.
Myers, B (2017). An Evaluation Of The Effect Of Instrument Geometry On Color Management For Printed Textiles. 2017 TAGA Proceedings.
Adams, R. M., Dr, Sharma, A., & Suffoletto, J. (2008). Color management handbook: A practical guide (1st ed.). Pittsburgh: PIA/GATF Press.
Images and targets (n.d.). Retrieved April 17, 2018, from http://www.hutchcolor.com/Images_and_targets.html
Category:Manuals. (n.d.). Retrieved April 18, 2018, from http://www.colorwiki.com/wiki/Category:Manuals